1. Intercompany Operational Flow
Put your finger directly on the pulse of your corporate network. Instantly isolate any mid-level operational node or service hub to inspect immediate upstream funding sources and downstream allocation methods. Perfect for transfer pricing verification, this focused lens cuts through global financial noise to reveal exact t-1 and t+1 relationship layers in real time.
2. Predictive Revenue Impact
Trace the future velocity and final destination of your working capital. Select any early-stage revenue stream, product line, or industry vertical to simulate how cash flows through payment terms and collection strategies. This forward-looking lens isolates downstream risks, exposing hidden structural delays and aging accounts receivable before they hit the balance sheet.
3. Cost Leakage Diagnostics
Reverse-engineer your corporate expenditures to find the exact origin of budget anomalies. Select any late-stage cost center, vendor invoice, or critical approval priority to instantly trace cash flows back to their root departments and specific activities. This historical diagnostic lens automatically isolates dominant origins, uncovering unexpected cross-charging leaks and unapproved budget overruns.
Intercompany Operational Flow
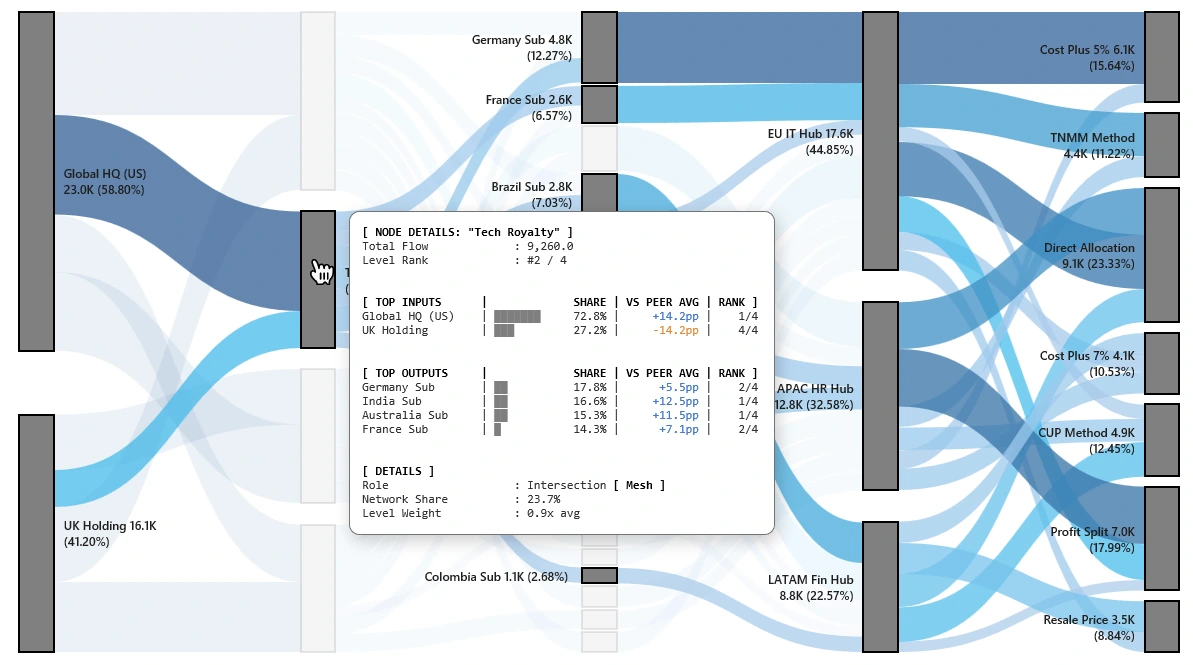
Objective: Verify that group-level service recharges and technology royalties match internal transfer pricing policies. The analysis isolates central clearing hubs to audit direct input sources (t-1) and immediate output distribution methods (t+1) without the noise of unrelated global flows. By applying a focused, localized lens on the intermediate layers, we examine the “Tech Royalty” node. The engine evaluates its role as an intersection point (Mesh), mapping its exact input share from corporate centers against its outbound allocation to operational subsidiaries.
Analytical Insights from the Model:
- Concentrated Funding (Upstream): The isolated view reveals that 72.8% of the total flow (9,260.0) entering the Tech Royalty layer originates exclusively from Global HQ (US). This represents a significant deviation (+14.2pp) compared to peer operational streams, highlighting an aggressive funding concentration.
- Subsidiary Dispersion (Downstream): Once inside the node, the capital immediately fragments across global entities. Germany Sub absorbs the largest direct share (17.8%), followed closely by India Sub (16.6%) and Australia Sub (15.3%).
- Methodology Alignment: On the final layer, the system tracks how these specific outlays align with audited transfer pricing models. Direct Allocation commands the largest structural volume (9.1K), while the remaining volume splits between Profit Split (7.0K) and CUP Method (4.9K).
Tax compliance officers can instantly verify if the Global HQ > Tech Royalty > Germany Sub flow adheres to local arms-length principles. The localized view proves that the current cross-charging matrix aligns with documented TNMM and Cost Plus agreements, providing single-click visual evidence for corporate tax audits.
Predictive Revenue Impact
Objective: Evaluate the downstream cash conversion velocity of distinct revenue streams. The objective is to simulate how early-stage sales categories propagate through corporate payment terms and collection workflows, isolating structural liquidity risks before they impact cash reserves. By selecting an early-stage product or revenue node, the engine suppresses network noise to project forward-looking outcomes. This maps the entire downstream trajectory, tracing the selected category’s specific distribution across final collection statuses at the end of the graph.
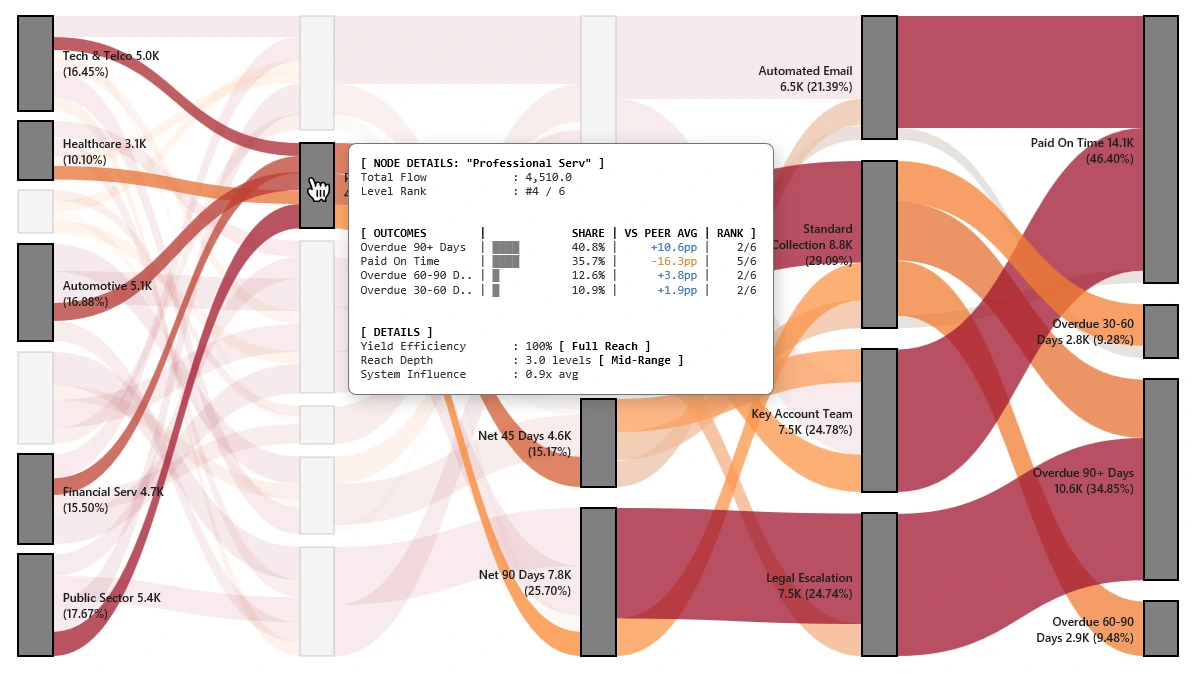
- Structural Collection Delays: Selecting the “Professional Serv” node (4,510.0 k EUR) exposes a severe working capital bottle-neck. A striking 40.8% of all revenue generated by this stream terminates in the “Overdue 90+ Days” bracket. This is a critical anomaly, running +10.6pp higher than the network peer average.
- Low On-Time Conversion: The on-time settlement performance (Paid On Time) for this stream stands at just 35.7%, underperforming the baseline by -16.3pp.
- The Risk Trajectory: Tracing the dark red stream visually confirms the root cause of this lag. Revenue from Professional Services disproportionately funnels into aggressive “Net 90 Days” payment terms (7.8K). This extended delay forces a high volume of invoices into the “Legal Escalation” tracking team (7.5K), which directly feeds the bottom-tier overdue pool.
Credit managers can immediately see that the collection issue is not an operational failure of the accounts receivable team, but a structural contracting flaw. The forward-looking simulation proves that the sales team is granting overly relaxed payment terms (Net 90) on Professional Services contracts. The immediate remedy is to enforce stricter upfront terms (Net 30/45) to mitigate long-tail collection risks.
Cost Leakage Diagnostics
Objective: Perform an operational audit on corporate expenditures to trace the exact structural origins of cost center anomalies. The objective is to pick a downstream cost aggregation point and reverse-engineer the financial flows to reveal unexpected cross-charging leaks and hidden organizational overruns. By isolating a specific cost center or late-stage processing node, the engine tracks the flow backward through the directed network. This filters out unrelated operational spending and calculates the exact parent attribution ratios on the preceding layers, pointing directly to the root source.
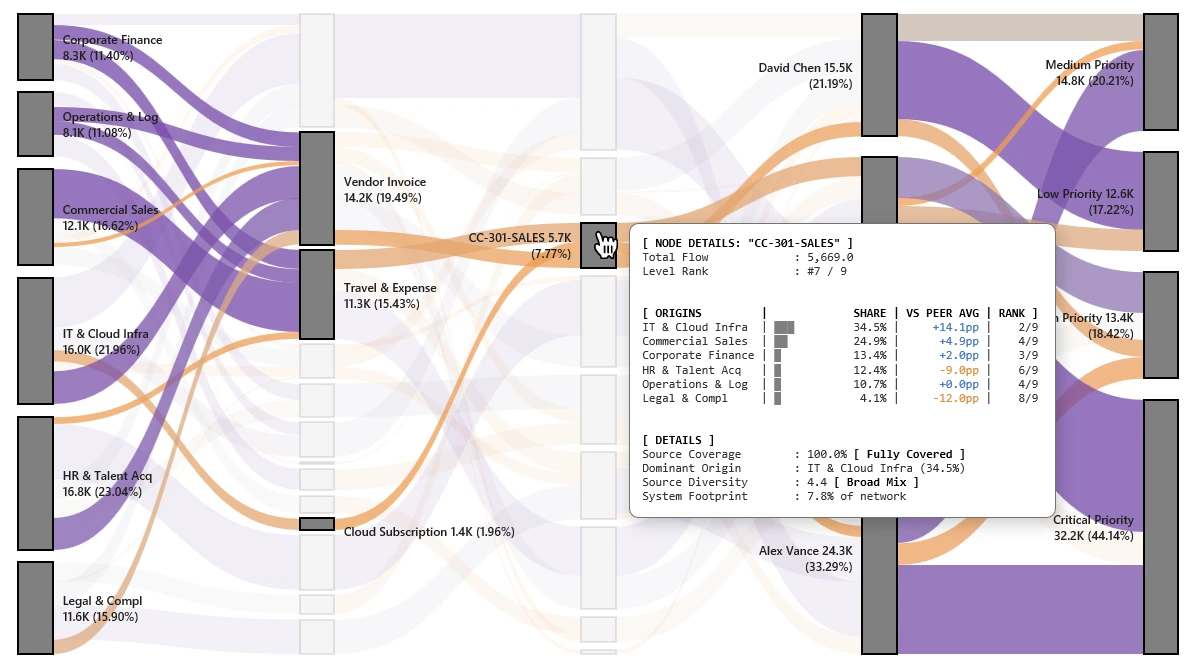
- Cross-Charging Anomalies: Isolating the “CC-301-SALES” node (5,669.0, accounting for 7.77% of the entire network) exposes a major cross-departmental charging error. Instead of being funded primarily by commercial teams, 34.5% of this cost center’s volume is driven directly by IT & Cloud Infra. This is an aggressive spike, running +14.1pp above the network’s peer average baseline.
- Broad Origin Mix: The Source Diversity rating of 4.4 [ Broad Mix ] confirms that this cost center is suffering from systemic fragmentation. Rather than serving a single department, it is acting as an unmonitored clearing house for a broad range of units, including Commercial Sales (24.9%) and Corporate Finance (13.4%).
- Downstream Dispersion: Looking forward from the audited node, the allocated capital is highly concentrated under Alex Vance (24.3K total layer volume), who pushes the primary financial strain into the “Critical Priority” approval bucket (32.2K).
Internal auditors can immediately identify that the budget overruns on the Sales cost center are caused by misallocated IT infrastructure costs rather than commercial overspending. The diagnostic audit provides instant visual justification to halt unapproved cross-charging, reassign the IT & Cloud Infra stream back to its proper technical cost center, and re-establish strict budget caps.