Don’t just draw flows, analyze them. Experience our analytical powerhouse with the free Sankey Diagram add-in.
Instantly uncover the story behind your data:
- Where did the problem start?
- Which teams or processes are affected?
- What is the bottleneck or outlier?
Why Enterprise Teams Trust SankeyEngine
SankeyEngine is a free Sankey diagram add-in for Excel that transforms complex flow data into actionable visual narratives directly within your spreadsheets. Standardized across all tiers: 100% data sovereignty, air-gapped security, and audit-ready precision. This foundation gives SankeyEngine its unique strength:
No coding, no cloud, no setup. It’s built for analysts who need to map complex processes, and for managers who want to see the story behind the numbers. The framework runs entirely within Excel – no cloud access, no external APIs, and no data leaving your workbook. This local-first architecture provides professional-grade speed and full control over your information. The result is a secure, high-performance environment built for teams who prefer insight without exposure.
- Local Execution: no cloud sync, no uploads, no external dependencies.
- Instant Responsiveness: real-time rendering directly on the desktop.
- Enterprise Stability: consistent results, no API failures or hidden services.
Use it to:
- Trace process and workflow transitions across multiple stages.
- Visualize budget allocations, resource distribution, or cost flow.
- Explore sales funnels, IT pipelines, or production systems with clarity.
Every diagram is rendered directly inside Excel, optimized for speed, precision, and presentation quality, so your analysis looks as good as your results.
We know that choosing the right data visualization tool often comes down to the question of “which one looks better,” while the real differences lie under the hood. We published this comparison to make your decision easier and to provide a clear picture of where the capabilities of traditional BI tools end and where specialized, high-performance analytics begin.
| Feature | Power BI (or Web Add-ins) | SankeyEngine Analytics |
|---|---|---|
| Architecture | Web / Canvas Rendering | Native High-Performance Engine |
| Data Security | Standard Cloud Security | Bank-grade (100% Air-Gapped) |
| IT Overhead (TCO) | Requires administration | Zero-footprint (No install required) |
| Scalability | Memory-dependent scaling | Hardware-optimized processing |
| Data Integrity | Visual Approximation | Audit-ready (100% Precision) |
| Analytics | General-purpose BI | Dedicated Math Layer |
| Business Logic | Manual DAX Coding | Automated Structural SSOT |
| Business Outcome | Visual reporting | Strategic decision-making |
| Disclaimer: Power BI is a registered trademark of Microsoft Corporation. This comparison is based on functional differences and is intended for informational purposes only. | ||
How to create a Sankey Diagram in Excel?
- Open Excel.
- Install the free SankeyEngine Add-in.
- Prepare your data in a simple table.
- Click the SankeyEngine icon.
- Customize colors and layout.
- Click OK. Your multi-level Sankey diagram is ready.
How to use SankeyEngine Add-in?
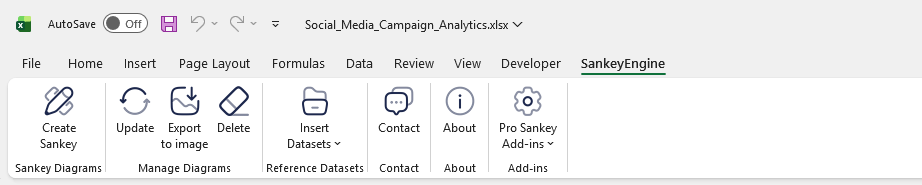
After successful installation, the SankeyEngine tab will appear on the Excel ribbon. This tab contains all the tools you need to create and manage Sankey diagrams.
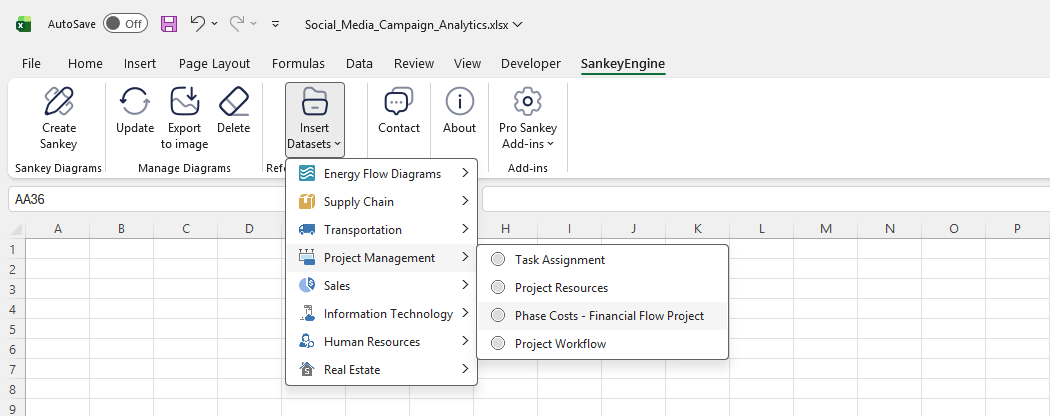
Prepare your Data (or Use the Built-in Templates)
You can either work with your own dataset or start from one of the built-in industry templates available under Insert a Template. These templates provide ready-made structures for areas such as HR, Sales, IT, Finance, and more.
If you prefer to use your own data, make sure it follows the required structure:
- Each column represents a stage or category in the flow, and all columns must contain text values (even if the labels repeat).
- The final column must contain numeric values, representing the magnitude or volume flowing through each path of the diagram.
- Every row describes a single flow, moving from left to right across the columns until it reaches the final value.
Once your data is organized in this format, you’re ready to generate the Sankey diagram.
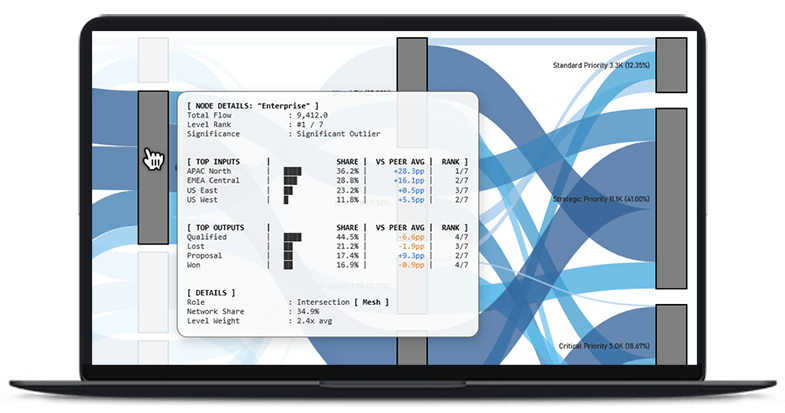
Your Data is a System, Not a Graphic. Read it that way.
After selecting your dataset, click the Sankey Diagram icon on the ribbon. This opens the customization window, where you can tailor the look and feel of your diagram before generating it.
The customization panel is not merely a settings menu – it is the Command Center of the SankeyEngine. While visual parameters allow you to align the diagram with your corporate branding, the true power of this interface lies in the “Real-time Insights” section. This is where you define the underlying analytical logic of your model before a single flow is rendered.
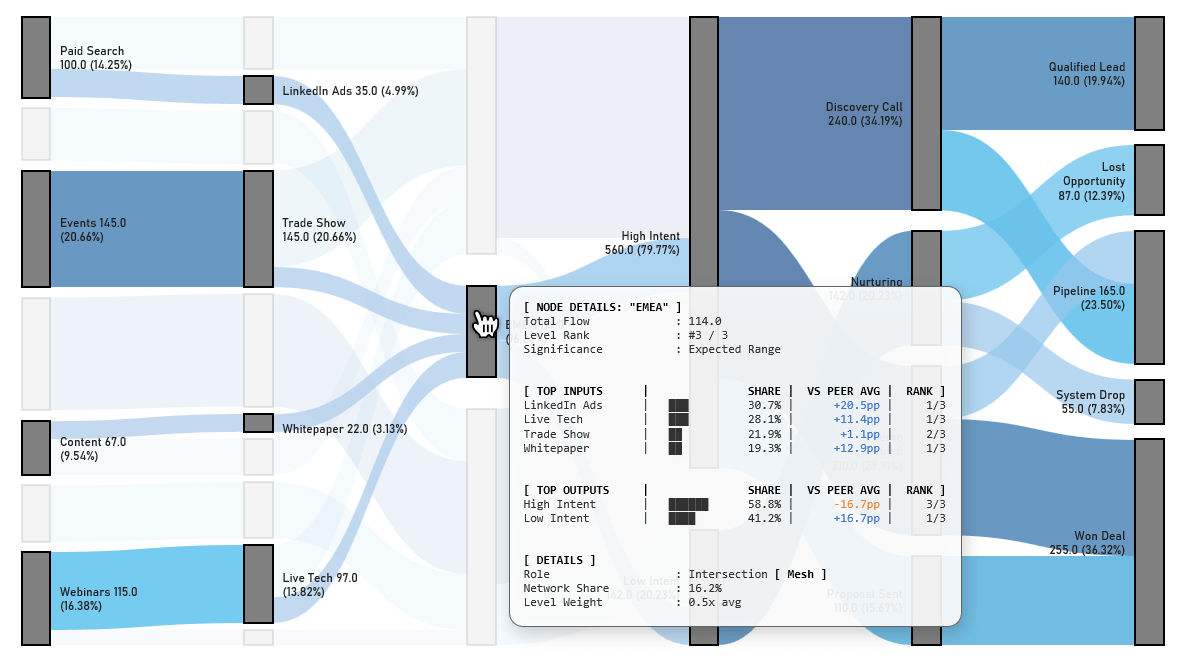
Three Primary Analytical Perspectives
By analyzing the topology of your data rather than just its labels, the engine provides three distinct ways to view your complex operations:
- Systemic Health (Mode 1): Provides an instantaneous assessment of any node’s contribution to the total system flow. It is designed to identify where resources converge and to flag Significant Outliers that require immediate attention.
- Impact Simulator (Mode 2): A predictive engine that shifts focus from current status to future consequences. Selecting any junction instantly traces every downstream trajectory, quantifying the “Domino Effect” of local interventions.
- Upstream Origin (Mode 3): Functions as a dedicated Root Cause engine. It performs a reverse-traversal of the entire system to answer the critical question: “Where did this actually start?”, providing absolute traceability back to the source.
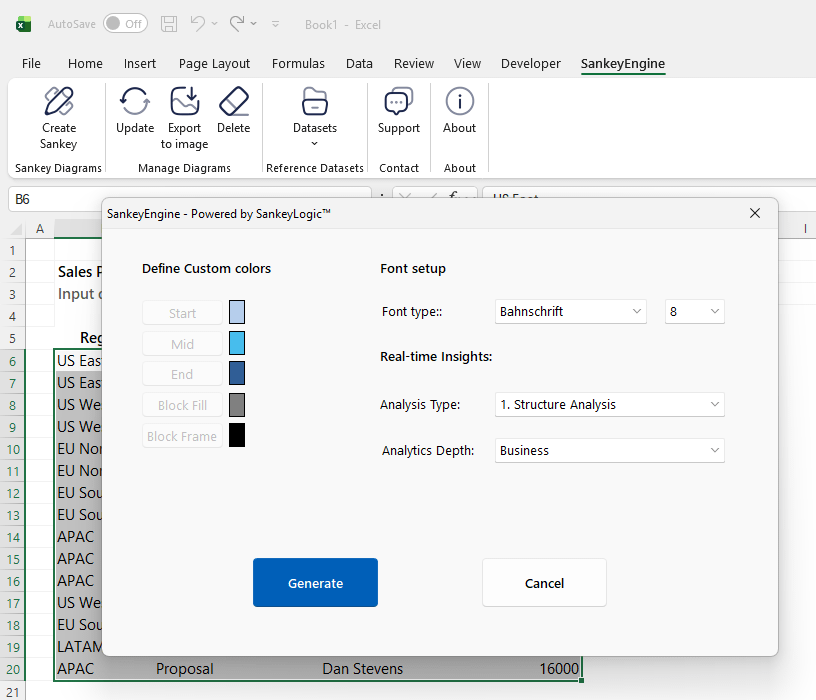
Strategic & Statistical Depth
To bridge the gap between high-level oversight and technical data science, every mode offers a dual-perspective view:
- Business View: Engineered for rapid strategic clarity, translating complex dynamics into actionable categories like Comparative Benchmarking and Systemic Footprint.
- Extended View: Provides the mathematical proof via an Advanced Diagnostics block, including Z-Score (Priority Rating), Entropy (Process Discipline), and the Gini Index (Concentration Profile)
If you’re curious about the technology behind the SankeyEngine Excel Add-in, and how it works under the hood, click here to learn more.
Insert a Sankey Diagram
Once you are satisfied with all settings, simply click “Generate to insert the final Sankey diagram diagram into your workbook.
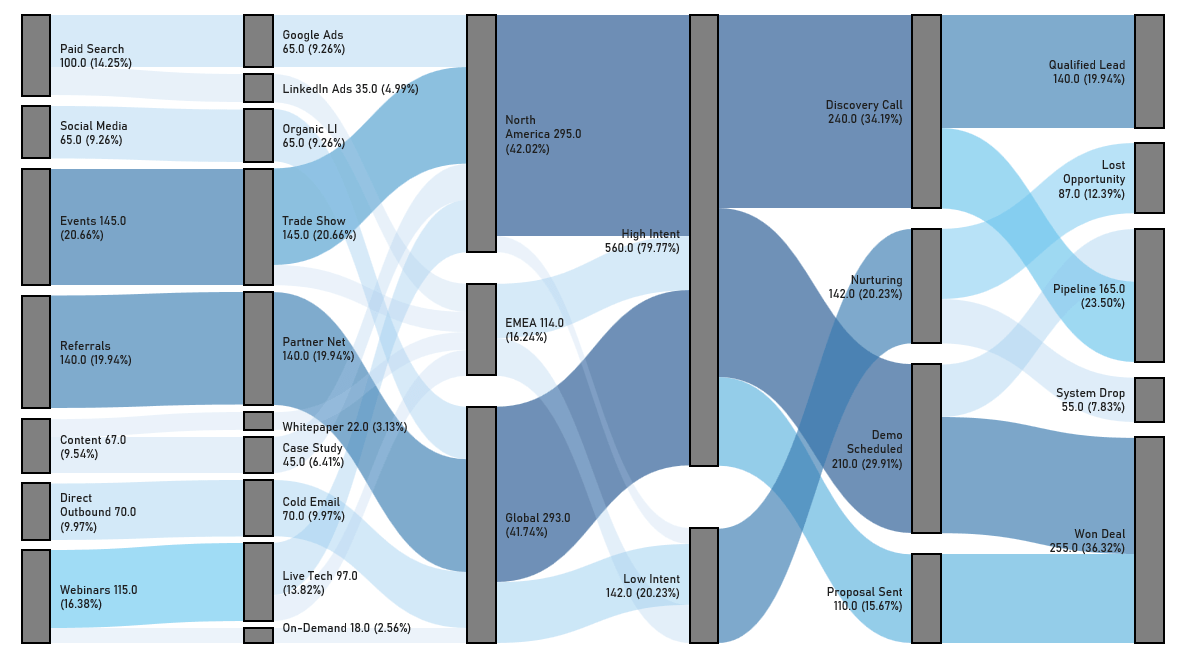
Real-Time Path Tracing in Excel
SankeyEngine supports real-time path tracing, a feature that makes complex flow diagrams far more intuitive to explore. As you move your cursor across the diagram, the engine instantly highlights all connected paths, allowing you to follow the flow from any point to its origins or outcomes without losing context.
This real-time interaction helps users quickly understand dependencies, spot bottlenecks, compare different routes, and reveal data patterns that would be difficult to identify from static diagrams. Whether you’re analyzing recruitment funnels, sales pipelines, financial flows, or operational processes, real-time path tracing turns the diagram into an interactive exploration tool rather than a simple visual output.
Proven in Academic Research
SankeyEngine’s precision and reliability make it a trusted tool for scientific data visualization. It has been featured in peer-reviewed publications, such as the study “Changes in the Patterns of Emergency Ambulance Care During a Primary Care Model Programme in Hungary” published in Healthcare (MDPI, 2026). Researchers use SankeyEngine to map complex transitions and healthcare workflows, proving that it meets the high standards required for academic dissemination.
SankeyEngine used in healthcare research – Read the full study on MDPI
See SankeyEngine in action!
Compatibility
SankeyEngine is compatible with Microsoft Excel 2016 and later, up to Microsoft 365.
If you’re curious how SankeyEngine’s flow geometry works under the hood, we’ve published a full breakdown of how to build a complete multi-level Sankey diagram manually in Excel – using only formulas and native scatter charts. It’s the same flow logic we automated into a one-click engine.